Investigate failed processes in the workflow log
Use the WorkZone Process workflow log to identify the reason why a process has failed or why an error has occurred during process execution.
You can access the workflow log using WorkZone QueryBuilder and WorkZone Configurator.
If you are investigating a specific process that fails, you need to know the process instance ID (also named Process GUID or process ID).
Look up process instance IDs
If you use the Process monitor service workflow to monitor processes, process owners can see the process instance ID and errors and warnings in the email notification that they receive in case of an error.
For SmartPost processes, users can see the process instance ID in the history document of the failed process.
If you do not know the process instance ID from a notification email or a SmartPost history document, you can use WorkZone QueryBuilder to create e a query that extracts all processes and their IDs.
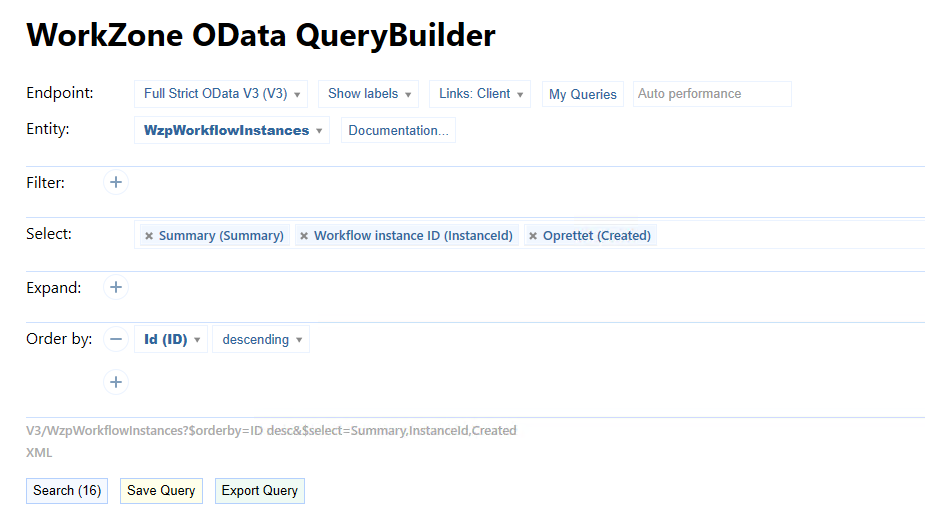
- Open WorkZone QueryBuilder.
- Select WzpWorkflowInstances in the the Entity field.
- Select, for example, Summary, WorkFlow instance ID, and Created in the Select field. It will show the name of the process, the instance ID, and the creation date of the process in the search result.
- Select descending in the Order by field to show the latest created process first in the search result.
When you know the ID of the process you want to investigate, you can create a query that extracts the errors and warnings generated for the specific process.
Extract errors and warnings for a specific process
Start by copying the process instance ID from the notification email, the SmartPost history document, or from the query result. Now, you can use WorkZone QueryBuilder or WorkZone Configurator to extract errors and warnings for the specific process.
WorkZone QueryBuilder
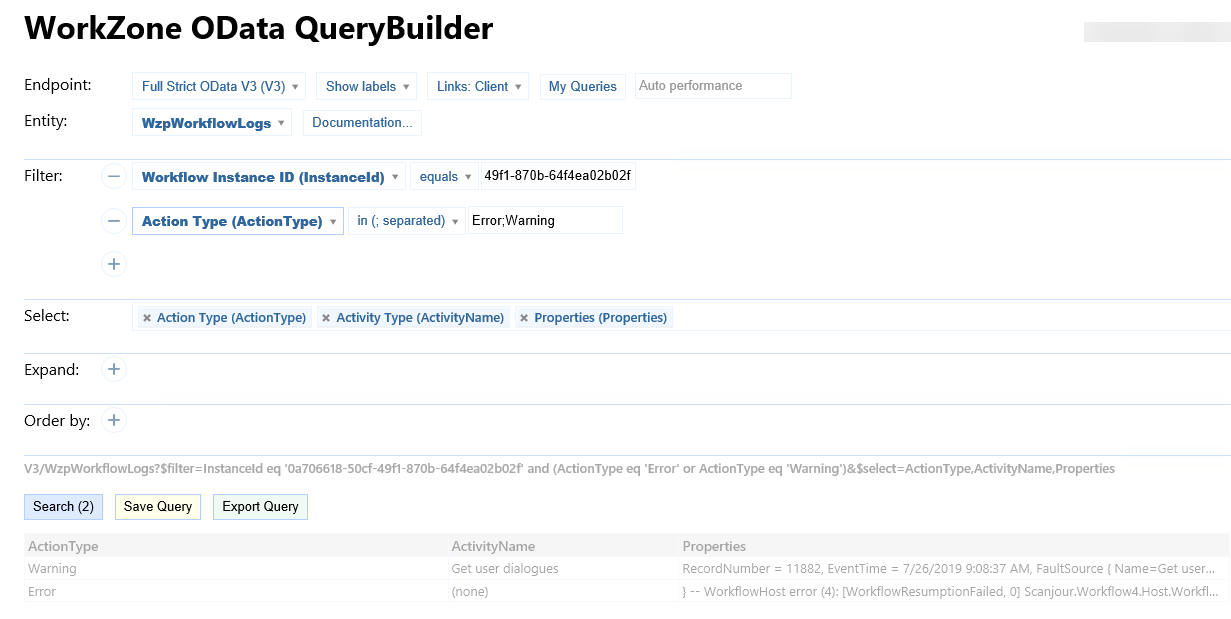
- Open WorkZone QueryBuilder.
- Select WzpWorkflowLogs in the Entity field.
- Filter on the process instance ID you just copied using the Workflow Instance ID field
- Filter on Error and Warning using the Action type field.
- Select Action Type, Activity Type, and Properties.
WorkZone Configurator
Prerequisites: You need the PROCESSADM access code to access the process
logs.
- In WorkZone Configurator, click Logs > Process Logs.
- Select a process instance ID from the droplist. A list of all process logs for this instance is displayed, where you can see the ID, server, process ID, time, instance, activity name and type, action, document type, and properties.
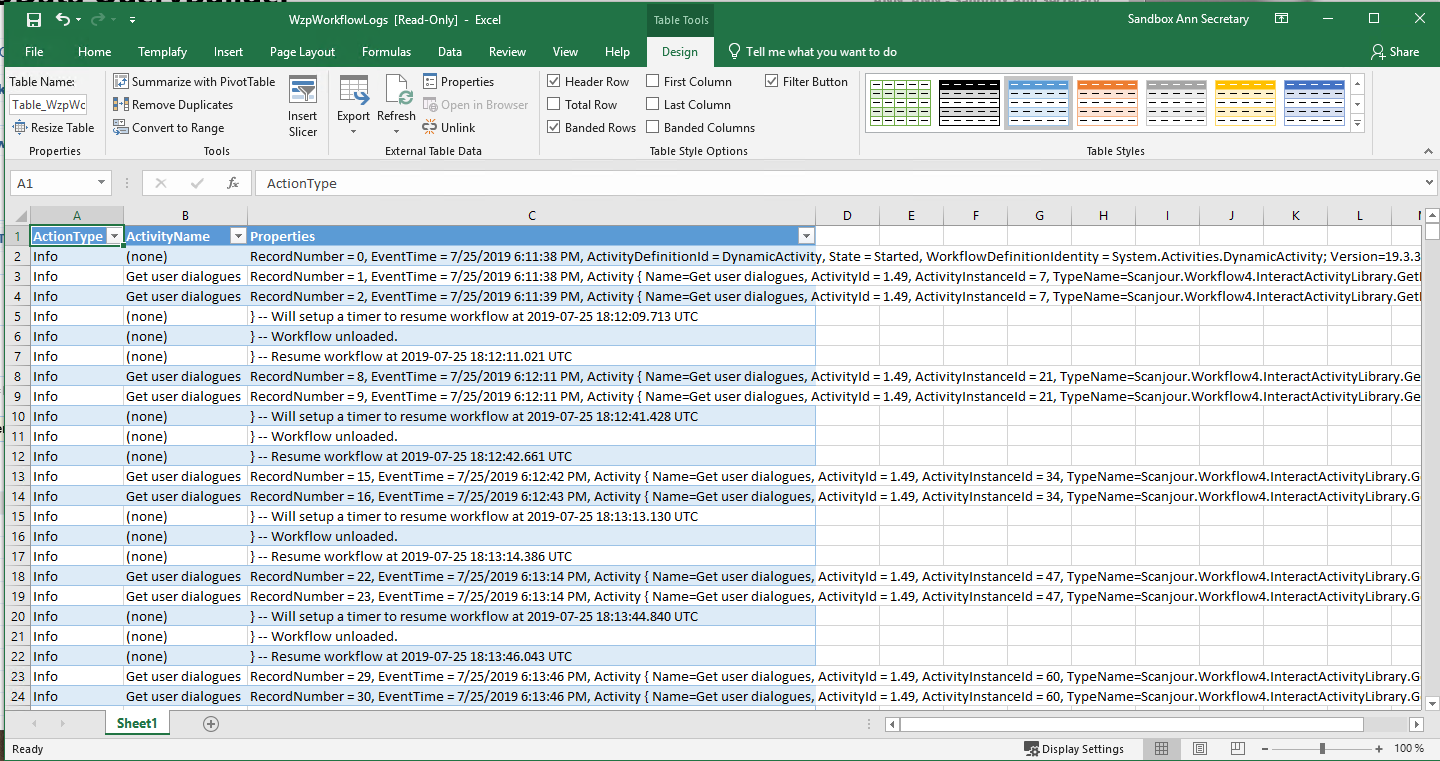
You can filter the displayed logs and export log information to Excel for further processing. See Export process logs to Excel.
View the full log
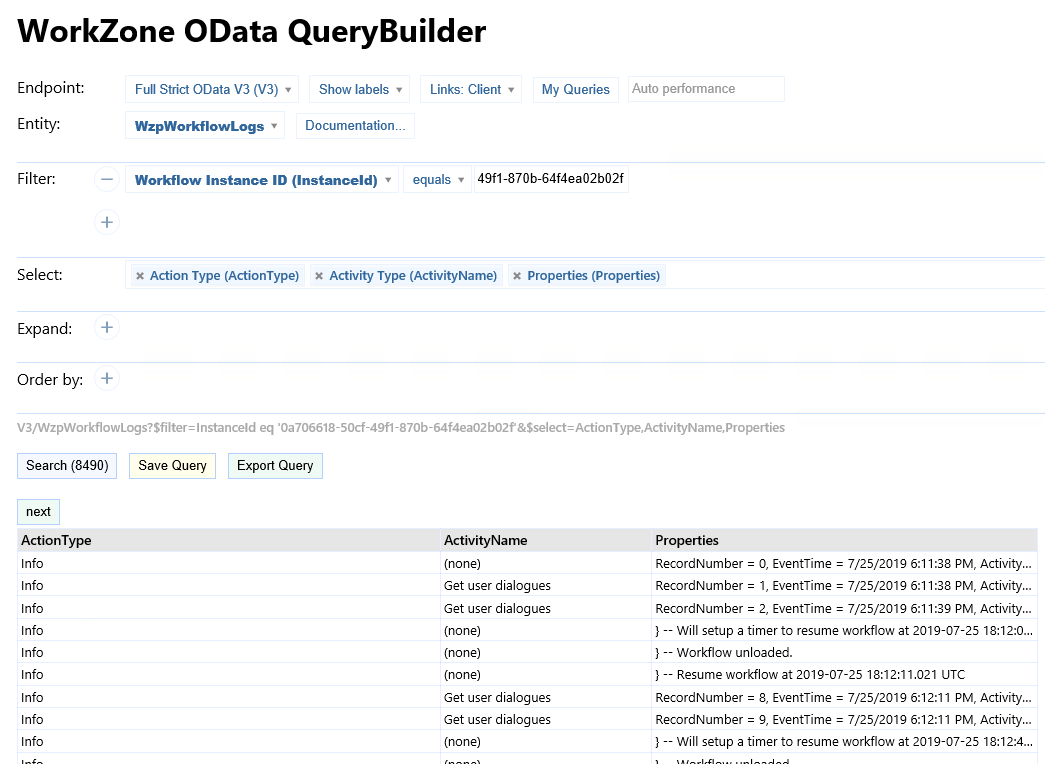
If you want to see the full log for a specific process, you can remove the filter on ActionType.
Example: Full log for a specific process ID
You can continue working with filter or export the query to Excel and continue filtering in the Excel sheet.