Monitoring
There are many ways to monitor WorkZone running on Kubernetes, so this serves as a guideline based on Grafana and Prometheus.
- Prometheus is used for gathering the logs. For more information, see https://prometheus.io.
- Grafana is used for visualizing the logs. For more information, see Grafana: The open observability platform | Grafana Labs.
To installing monitoring using Prometheus and Grafana, see the following guide: Using Azure Kubernetes Service with Grafana and Prometheus - Microsoft Community Hub.
To use the monitoring tools for WorkZone, see Monitoring using Grafana and Loki.
There is also an option to use Azure Monitor and enable Promotheus and Grafana in this service. See Azure Managed Grafana | Microsoft Learn.
Monitoring using Grafana and Loki
Grafana Loki is a log aggregation system, in this specific case, prepared to browse AKS containers logs(pointed to the stdout and stderr).
Requesting access
If prompted for credentials, use the Sign in with Microsoft button.
To request access, contact WorkZone-DevOps-Cloud@kmd.dk.
Usage examples
Log browser for each environment will be available at https://<ENVIRONMENT_URL>/grafana/explore (for example, https://cat-aks.test.workzone.cloud/grafana/explore for CAT-AKS).
There are two ways to build a query:
- By using the built-in query builder
- By typing it manually, based on the LogQL query language. For more information, see https://grafana.com/docs/loki/latest/logql.
Use the built-in query builder
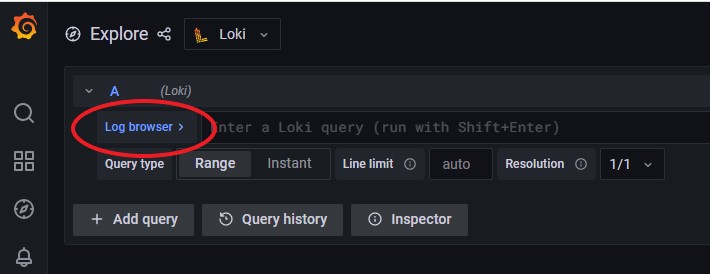
- To access the built-in query builder, on the main page, click the Log browser > button.
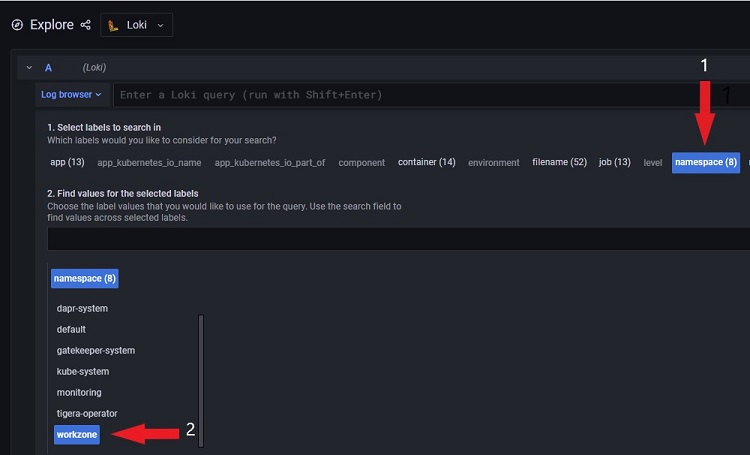
- To view the logs of the containers as efficiently as possible, set the appropriate namespace.
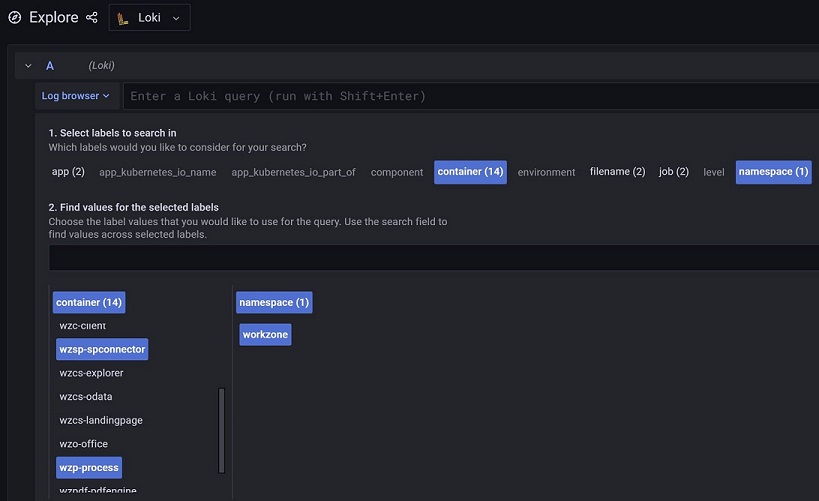
- Select specific container from the list. You can select a few, and combine them in one result.
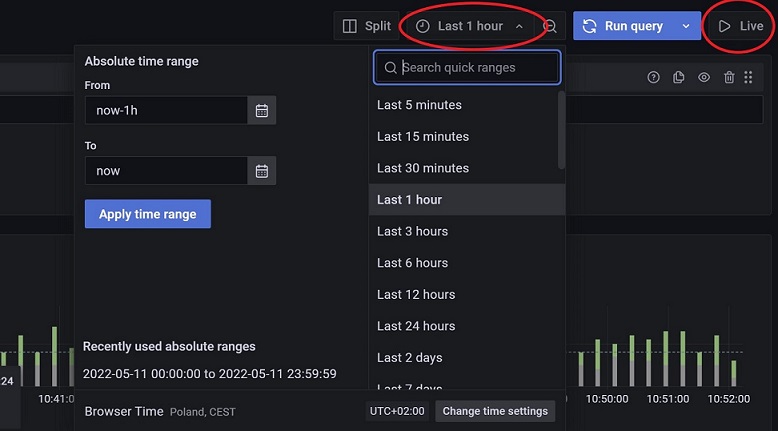
- After you have selected all options, click Show Logs to see the logs. You can specify the requested time range in the upper-right corner, or set it as Live with auto-refresh.
-
Perform the needed search:
- To find a specific phrase, use the
|= "<string>"parameter .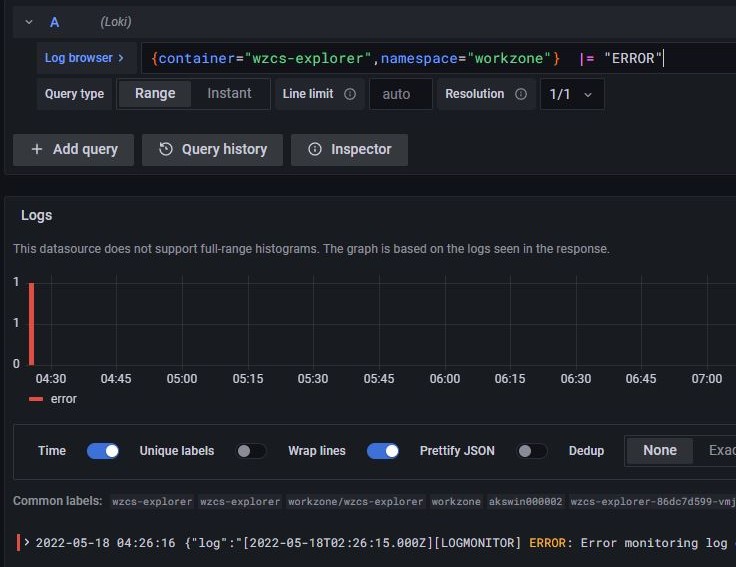
-
To filter a phrase out, use
!~ "<string>":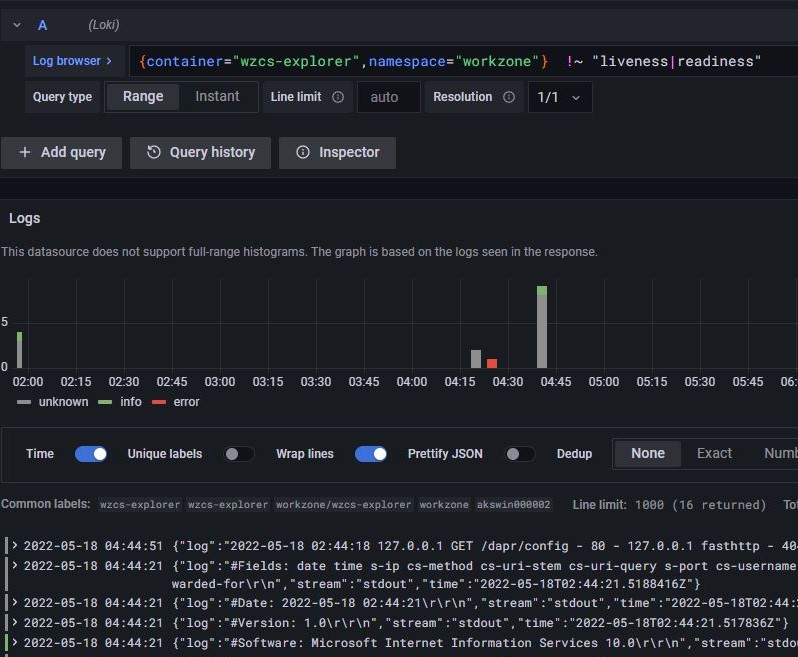
- To find a specific phrase, use the